Defining the Indicators for your Outputs is a really crucial step in your MEAL process, and one that will help you monitor your Output progress significantly!
Here are some tips and direction for monitoring project outputs:
From the Indicators page, you can work on outputs one at a time in the pop-out box where you think through and add the Indicator Calculation (how will you calculate the results for this), and Indicator Satisfaction (how do you know if the Indicator is met).
You can add these definitions into custom columns on the Indicators page.
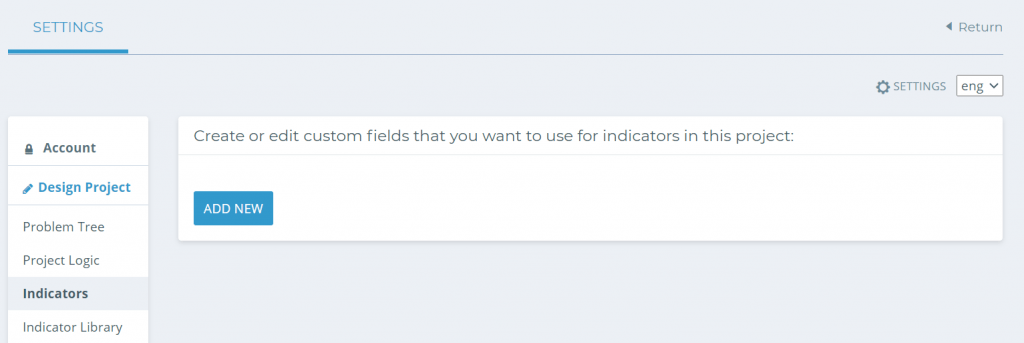
To create a custom column, go to the Settings page from the gear icon in the top right hand corner of the Indicators page.
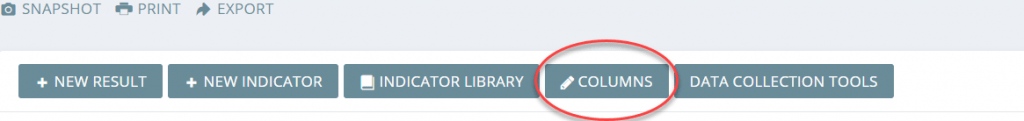
Or, you can go to the Columns button next to the Indicator Library from the tabs along the top of your page.
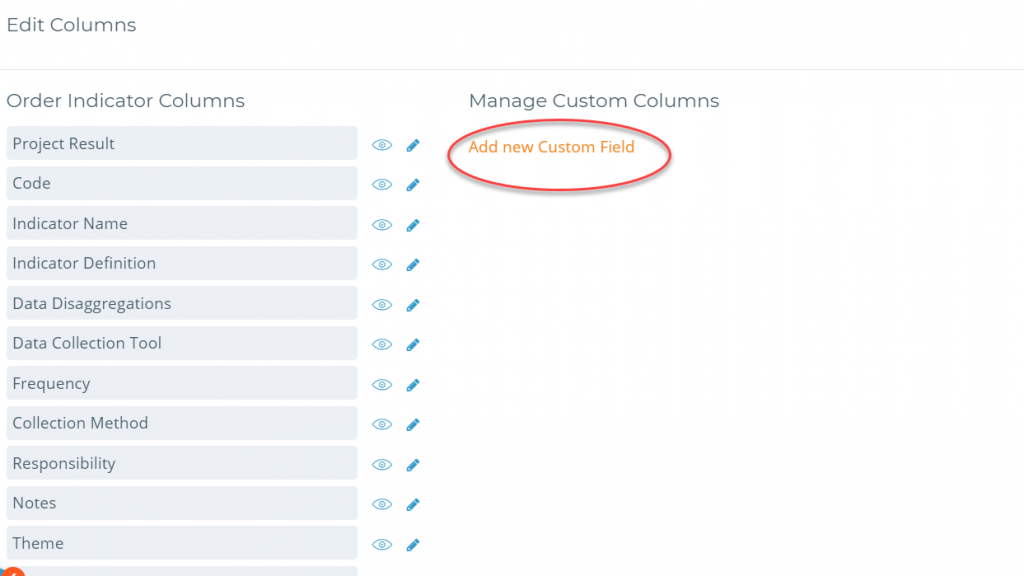
From here, you can edit and manage your custom fields (hide them using the eye!), and add new ones.
When you are creating your Output Indicators, you may be thinking through if you want to have all your Outputs grouped together under the same Data Collection Tool (DCT).
That can be useful if your project staff are the ones reporting on the Outputs – they can always use the same online form. For example, which you can choose and control on the Data Management page!
However, that doesn’t always make sense – depending on your different beneficiaries and timelines. This step is all about customizing Kinaki to fit your experience.
Our tutorial videos on Data Collection Tools will help explain when and why you might want or need to do this.
As a rule of thumb, output indicators – which you would traditionally collect data for within one paper or Excel form – will likely be in one DCT.
Make sure you read through the MEL Design and Indicators page content about how to add indicators, and how to track them and choose data collection tools and methods.