You can customize the report according to your needs. Once finalized, you can view and share it, from the Reports page.
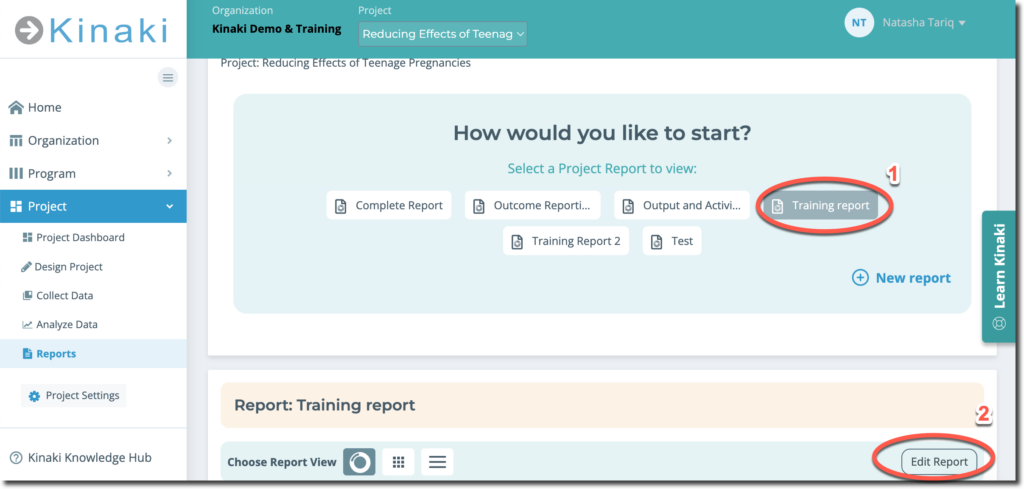
On the Reports page, choose the report you want to customize. Then, click on the ‘Edit Report’ button the right.
Editing Columns
To edit columns, go to the ‘Edit Columns’ tab.
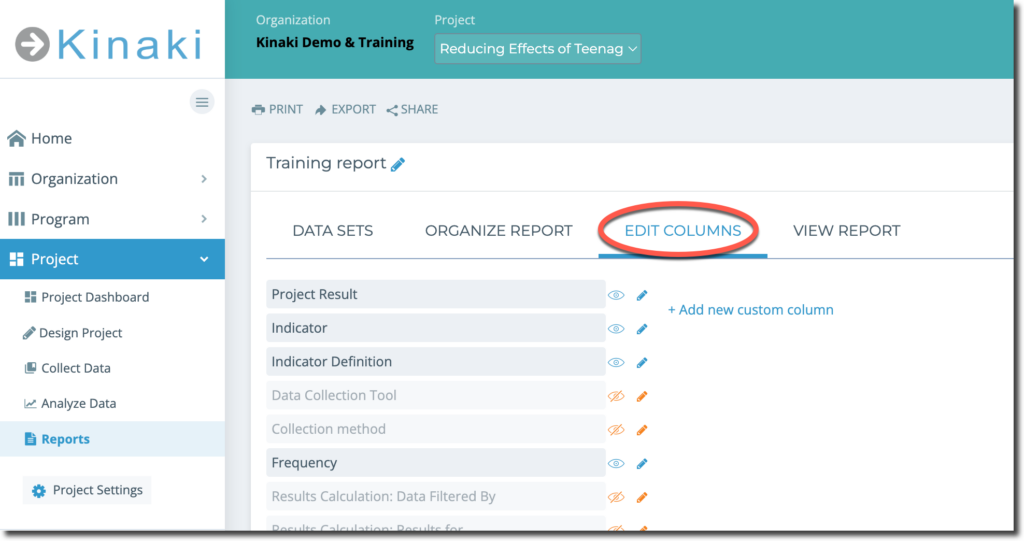
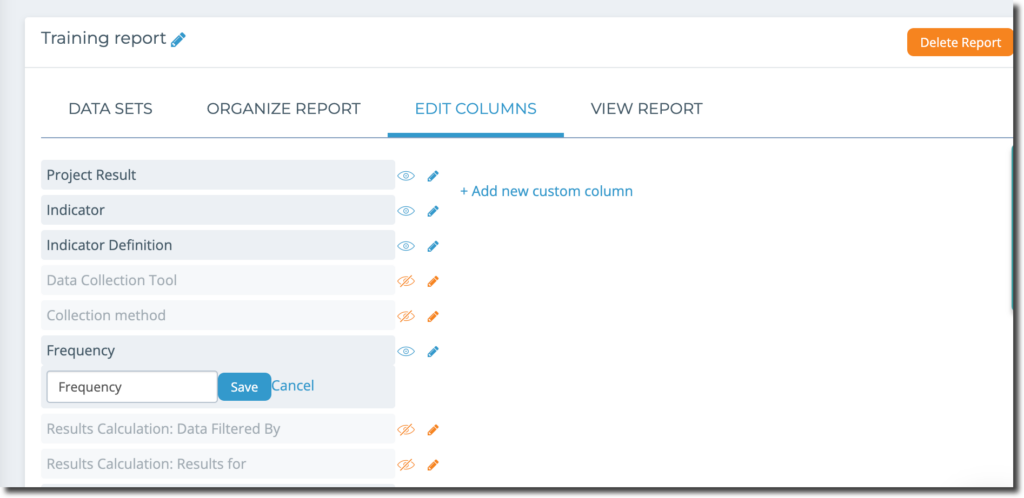
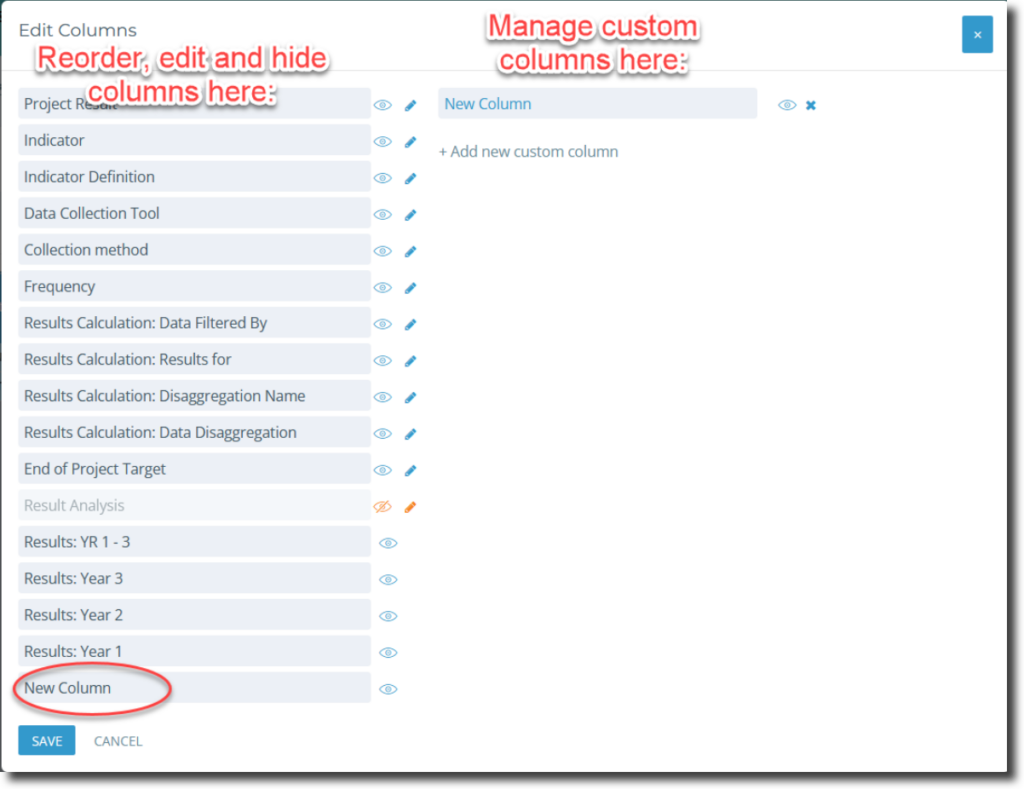
When editing columns you can decide which ones should be visible in the Report, add new columns or re-arrange the order of the columns. By clicking on the pencil icon, you can edit the column name and by clicking on the eye icon, you can show/hide the column.
When you select ” Add New Custom Column” you can give your new column a name and it will appear when you have saved the new column name.
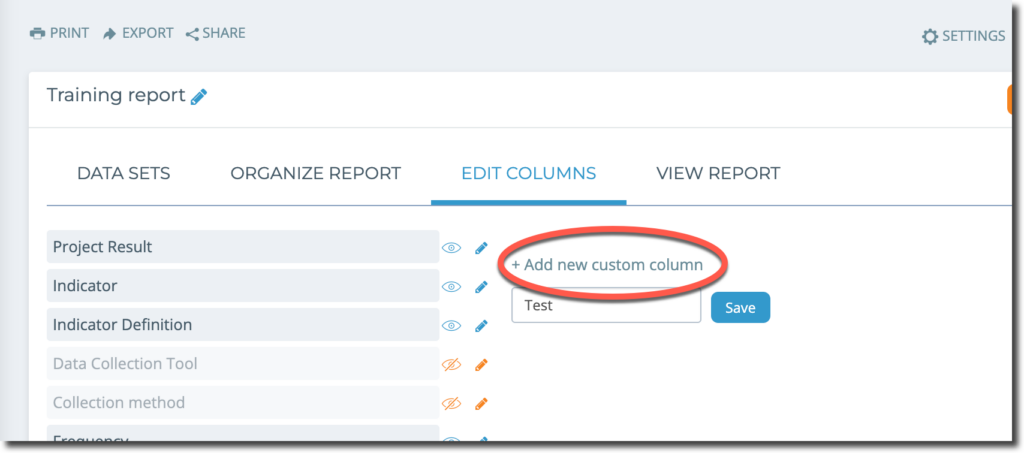
It will appear on the left-hand side under the list of all the existing columns, as well as in a list on the right hand side with all other custom columns that were made. Drag-and-drop it into place to rearrange where the new custom column appears in relation to the other columns.
When you have saved your changes to the columns, you can view the Report by going to ‘View Report’ tab.
Displaying Results
Using the “Organize Report” tab, you can change the order in which the indicators show in a report (remember that indicators attached to a single result will always stay together).
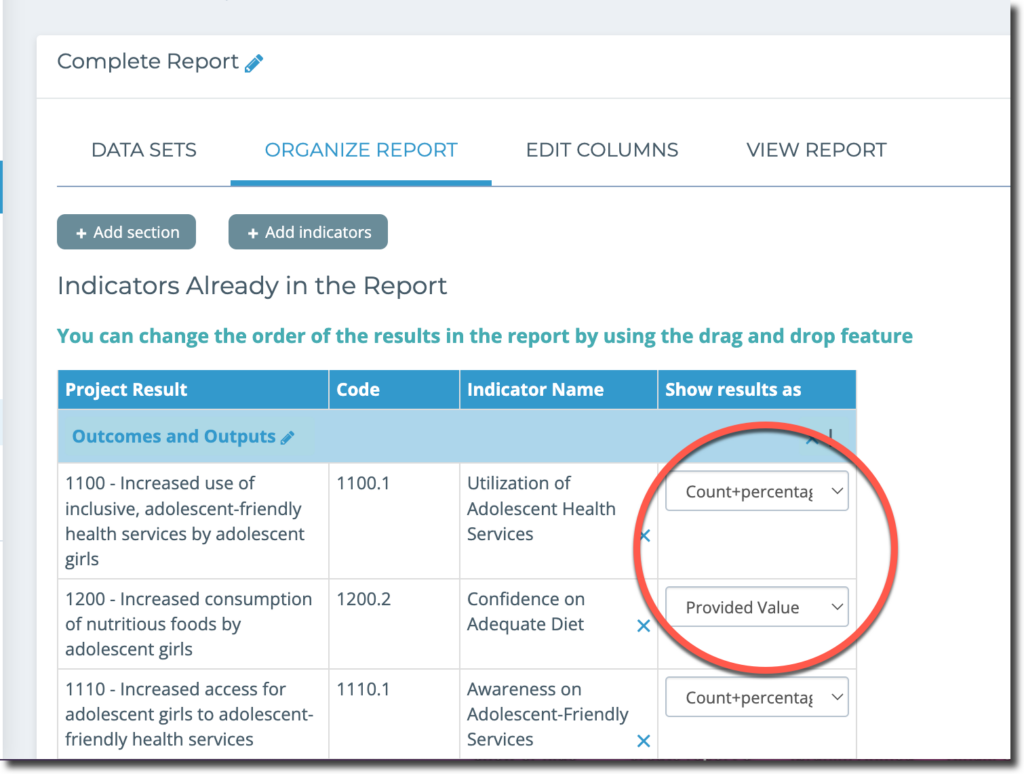
Now that you’ve selected the indicators you want to see in your Report you will see them listed on this page along with how the results will be presented in the “Show results as” column.
You can change how the data will be presented in your Report from the available options in the drop-down menu next to each indicator.
Note: You may want to return to this page if the values in your report appear incorrect. You may need to change how the results are shown and select the correct format from the “Show result as” options. For example, numerical values may be set to “Count” by default and appear as an incorrect fraction value, but can be changed to “Count Percentage” to show the true values.
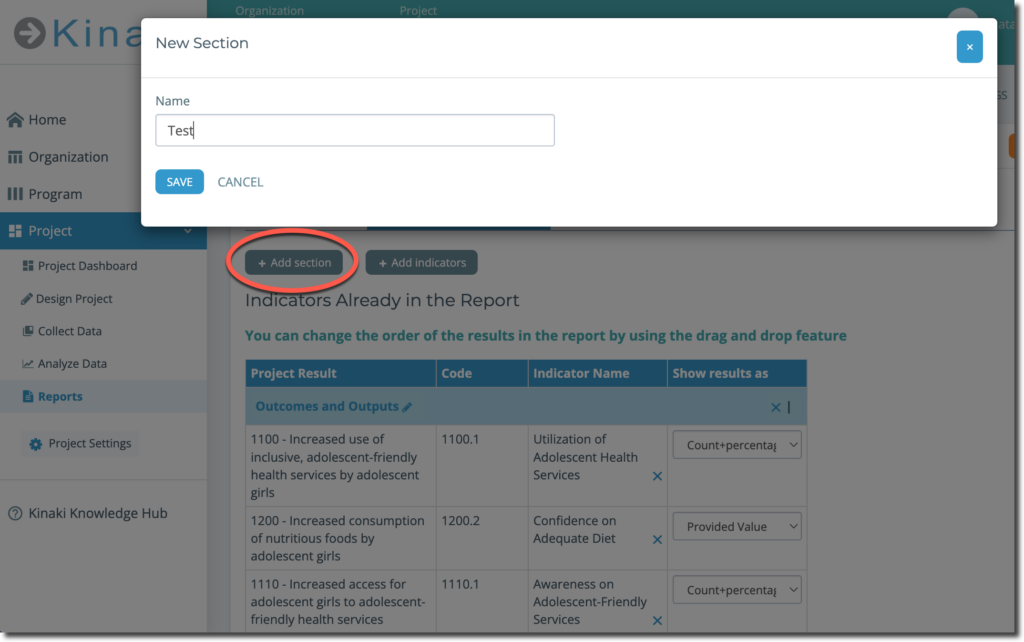
By default, all of your information is organized into a single section – but you can change this and sort your report by different sections, by clicking on “+Add section” and then you can title and sort it however you like.
Next, let’s look at how to add and manage data sets for Reports.
As review, watch the video on Project Reports!
Check out Chapter 7 of this video to learn more!