You can group datasets together to display results from different Data Collection Tools side by side, but under one column in your report.
With different data collection tools (say activity tracking and a household survey), you can’t necessarily combine or aggregate the results (as they are using a different methodology), but you might still want to see them next to each other.
This function allows you to compare datasets in a clear visual way.
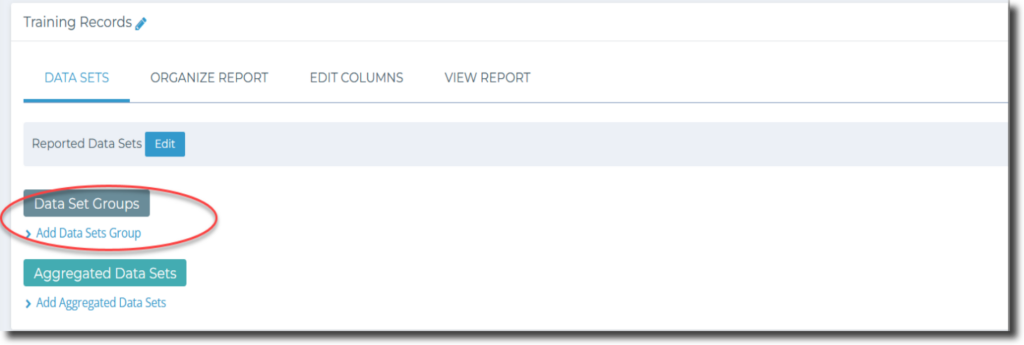
To add a Dataset Group, click on “Edit Report” and then under “Data Sets” tab, click on “Add Dataset Group”.
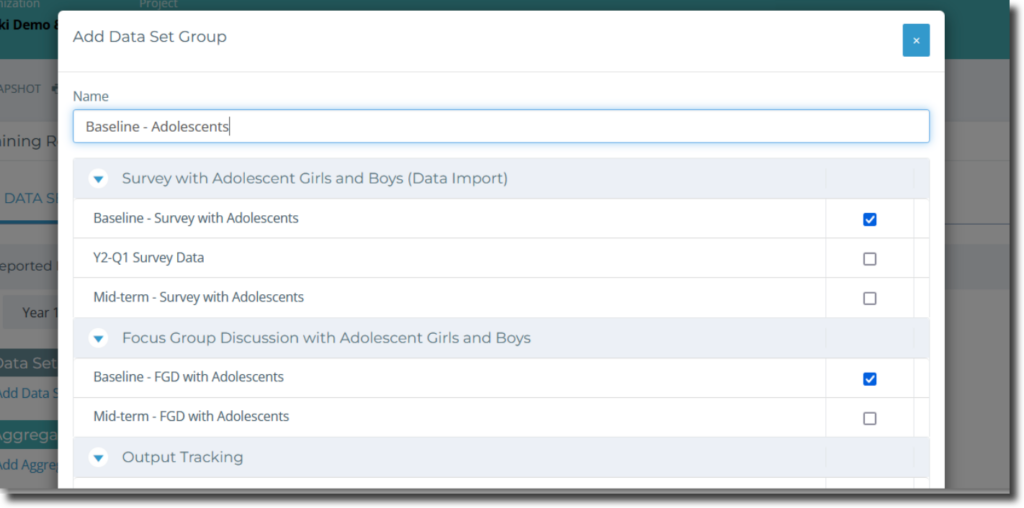
In the pop-up window, select the data sets you want to group together and give them a name in the “Name” field at the top of the window. Click “Save” to save the group.
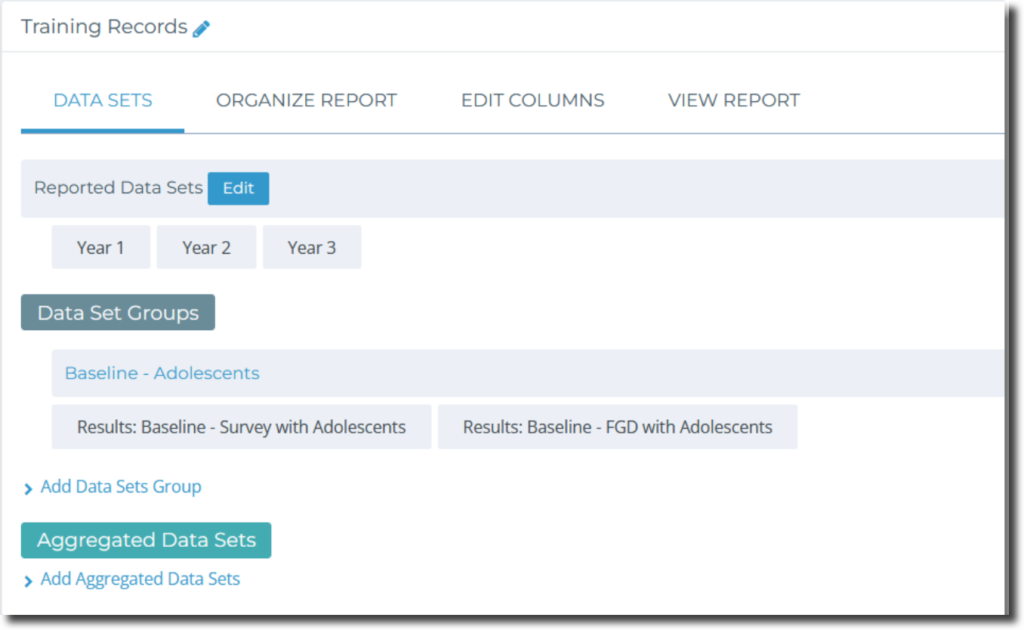
Your new group will appear under “Data Set Groups”:
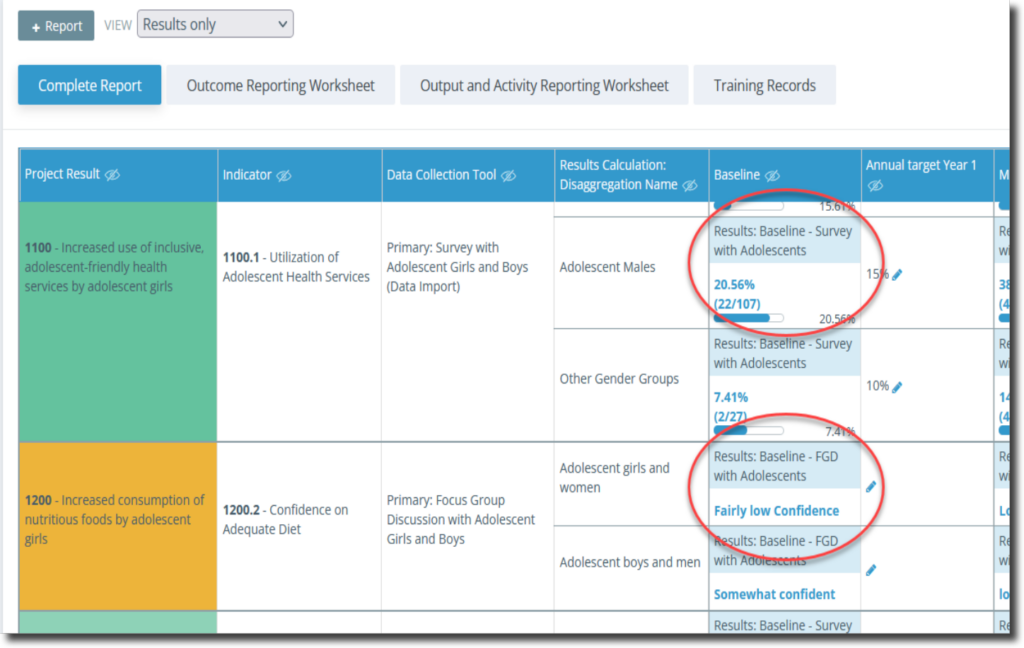
When you view the Report, you will see that the Survey results and FGD (Focus Group Discussion) results are in the same column next to the indicators they were used to measure:
Next, let’s create an Aggregated Data Set and add it to the report!
Check out Chapter 8 of this video to learn more!