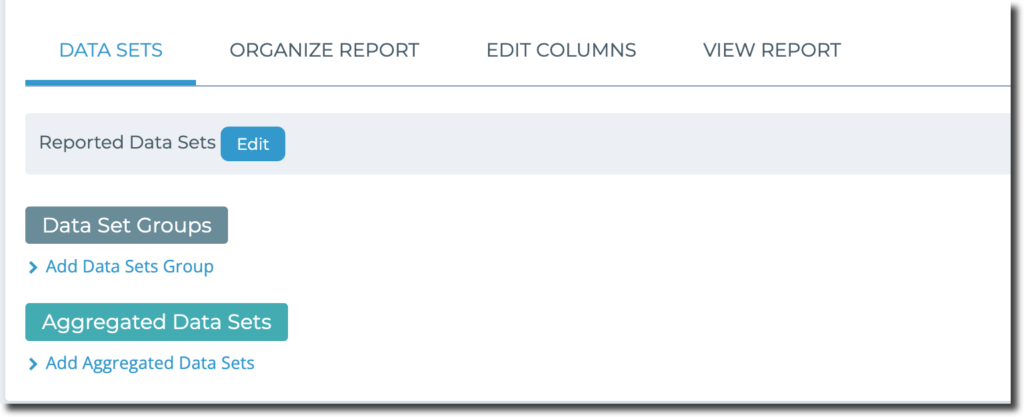
Aggregated Datasets allow you to combine data from multiple datasets within the same Data Collection Tool. For example, you can aggregate data from quarterly activity tracking, to get numbers for the whole year.
Note: Any aggregated dataset created will be made visible on the “Analyze Data” page for data analysis and the “Data Management” page.
To aggregate datasets, click on “Edit Report” on the main report page, after selection the report you want to work on. Under “Data Sets” tab, click on “Add Aggregated Datasets”.

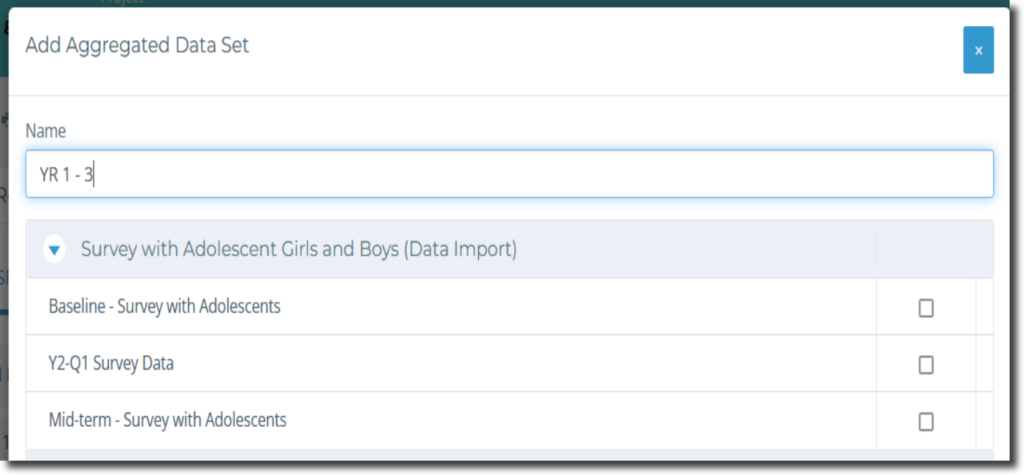
Like when adding the other data sets, you’ll notice that in the pop-up window data sets are organized under the Data Collection Tool. Select the data sets you want to aggregate and give the new aggregated data set you’re creating a name in the “Name” field at the top of the page, and select “Save”.
In this example, we selected 3 data sets from one data collection tool, and aggregated them into one data set “Yr 1-3” combining 3 years of data into one.


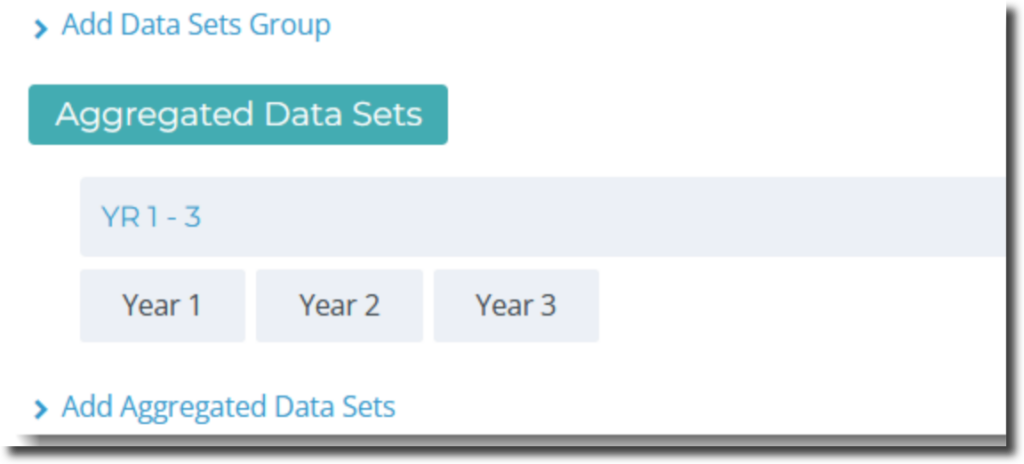
Now you’ll see the newly created data set appear under “Aggregated Data Sets”:

Now it’s time to view your report!
From the “Report Settings” page you can select “View Report” and see what your report looks like thus far. You can choose from three different types of views!
It can take some adjustments before the Report appears exactly as you would like. Reports require the most work the first time you create them, but if you use the same Report multiple times it becomes easy to add new Data Sets and see the results you want right away.
When you are viewing your report, click on “Edit Report” to make adjustments:
– To adjust how calculations appear go to “Organize Report”
– To adjust which columns appear and in which order select “Edit Columns”
Check out Chapter 9 of this video to learn more!


