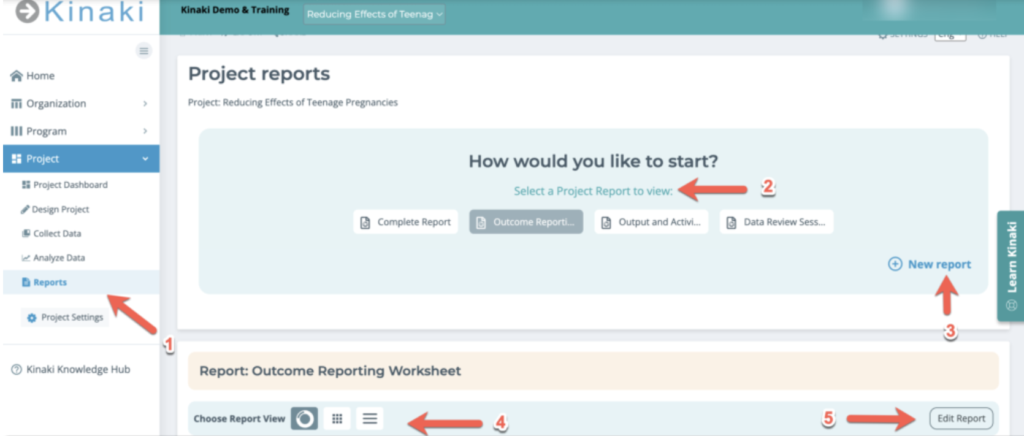
The Reports function allows you to generate, edit, and compile data for further analysis and tracking – based on the Project data and indicators that you have included for your Projects in Kinaki.
On the Reports tab (1) you can view any of the existing Project Reports (2), create a New Report (3) and also choose the Report View (4) from one of three options: Results View, Table View or Narrative View. You can also choose Edit Report (5) from here.
You can create multiple reports for each Project in Kinaki depending on your needs. For example:
- You might have a longer, detailed report for your donor who wants to see progress across all your project indicators on a quarterly basis and you might have another report for your communications team who are interested in seeing the results of only a few specific indicators on a semi-annual basis.
In this section, we’ll walk you through how to create a project report, and how to add indicators and adjust columns for those reports.
You can do tasks like group indicators together to see just the ones you need for a specific reporting purpose.
The reports function allows you to generate, edit, and compile data for further analysis and tracking – based on the project data and measures that you have included for your projects in Kinaki.
Another important part of creating Reports in Kinaki is assigning and aggregating datasets. You can find out more on this page of the guide.
If you are a Project Admin you will be able to set up and view Reports.
If you are a Project Member you will be able to view Reports created by Project Admins. Contact your Project Admin if you need your user type changed.
Currently, information can only be added to a Report from calculated Indicators. This includes narrative information, which can be added to provide an explanation of a calculation. However, this means that you cannot manually enter information into a Kinaki report.