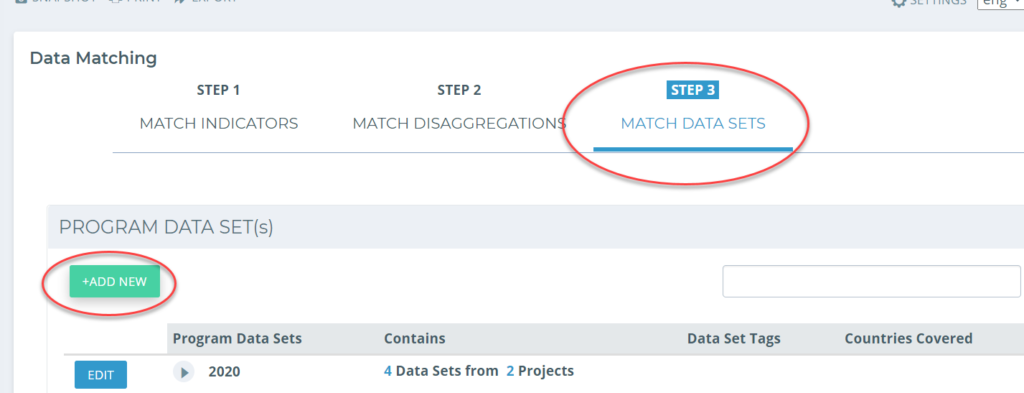
Step 3: It’s time to matching data sets to create one neat column in report.
Start by selecting “Add New” .
In the pop-out box that appears, fill out a name for your Program dataset, based on the attributes you are choosing (i.e. by year, like 2020, if you are selecting all datasets that contribute to an annual report).
Then, go through the list of datasets for each project and find the relevant entry that responds to this indicator.
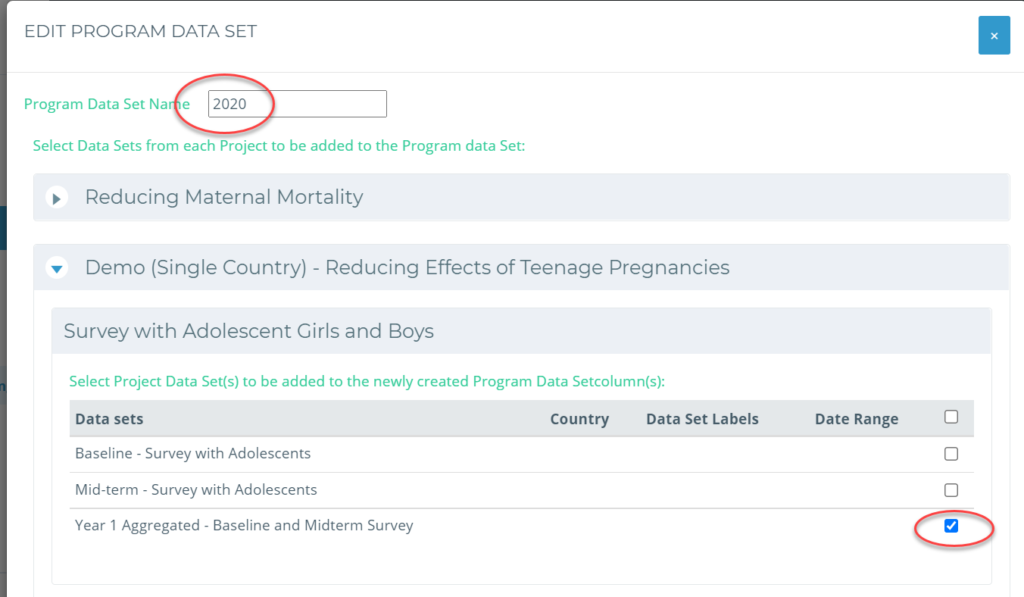
You will need to do this for each Project that has a relevant dataset. Once you have saved your work, you are ready return to the “Program Report” page once again with the completed information.
Click on Program Reports from the main menu on the left-hand side of the page.
You can edit an existing report or create a new report, this time with the datasets you want to include, alongside the projects and indicators you want to include. Then save and view your report!
Let’s look at how to add these data sets to the Report.
Adding matched data sets to your Report
Return to the “Program Reports” page and click on the name of your Report.
Go to the “Organize Report” page.
Under “Indicators Aggregated from Project Results” you will see the Program Data Sets that you created. Check the box to the left of each data set you want to include in the report and select “Save and View”:

You will be taken to the “View Report” page where you will see your Report with the two data sets (each with it’s own column in the Report) under the “Indicators Aggregated from Project Results” section:
