Let’s learn about the Project Dashboard!
Each project in Kinaki has its own Project Dashboard which hosts valuable information about the project in one spot and gives easy links and access to other relevant pages.
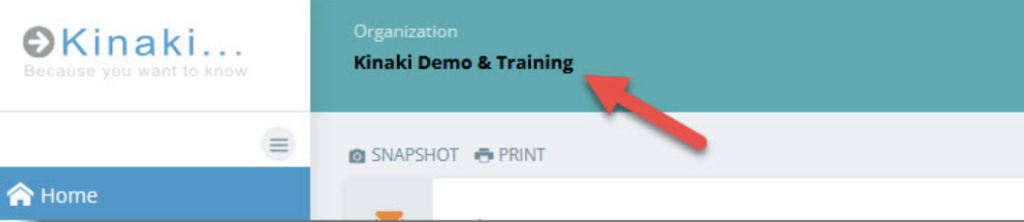
If you are registered in Kinaki, log in and go to the Organization Selector to choose your Organization and follow along! You can also choose Kinaki Demo & Training and choose our training project, Training Project: Reducing Effects of Teenage Pregnancies, to check out the features.
Next, select the Project from left menu and use the Project Selector drop-down menu to select the Project you want to look at.
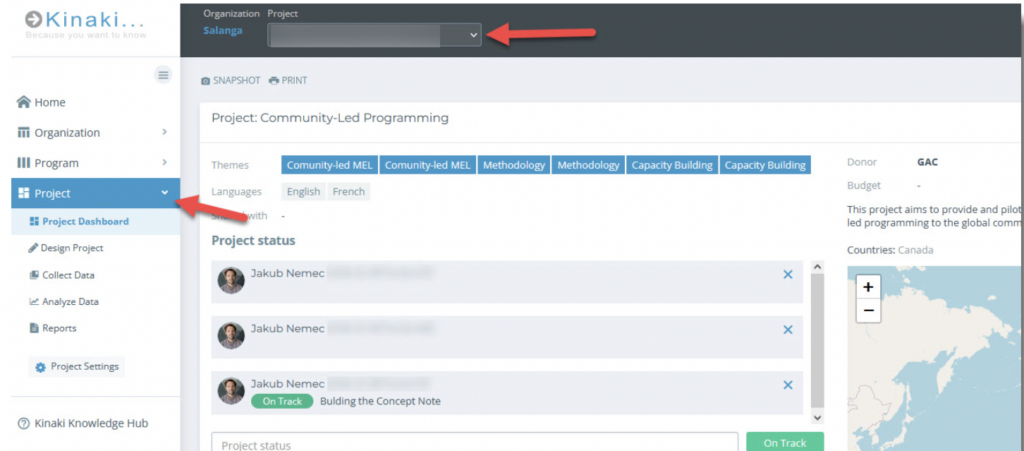
Then, under Project on the Main Menu, select Project Dashboard, as highlighted in the image above.
The Project Dashboard allows you to see a high-level overview of what’s happening in your Project by giving you important details about your Project Logic, Data Collection Tools, Indicators, and Reports. It’s essentially a project snapshot with easy access to important information that you can look up quickly.
Scroll through the Dashboard to see the features that are available. The project ‘Themes’ and ‘Custom Fields’ are populated through ‘Project Settings’ that you can access if you are a ‘Project Admin’.
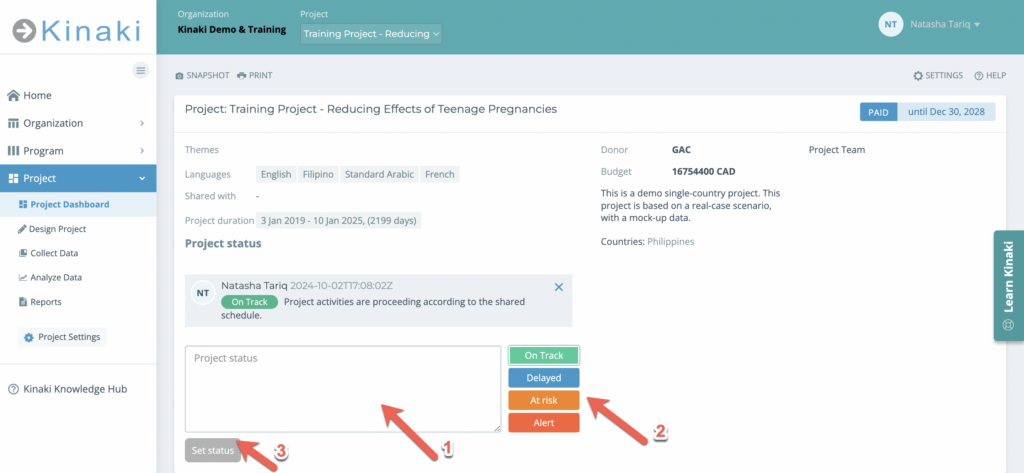
As a project admin, you can also set or update the status of a project from here. By doing this, you will let your other team members know the progress of the project (On Track, Delayed, At Risk) or set an Alert to grab the attention of your team.
Project Logic and Indicators
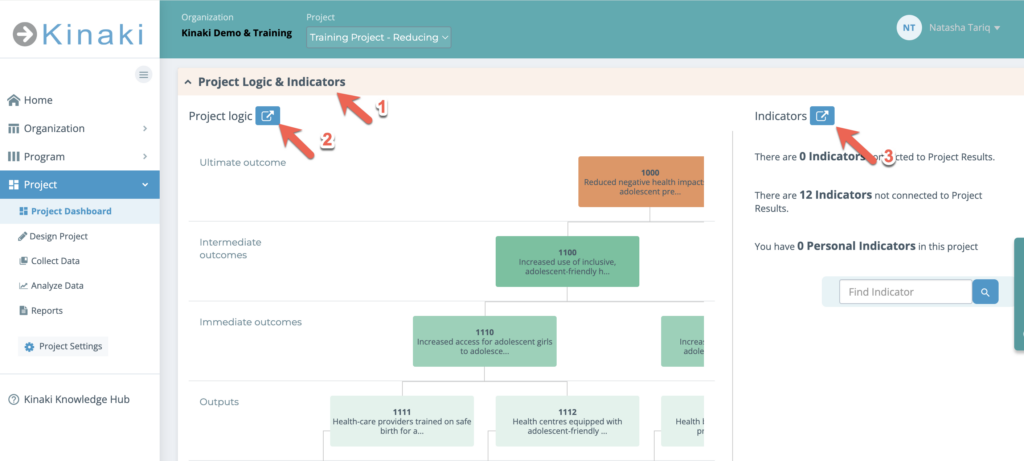
Under the Project Logic and Indicators tab (1), you can find a snapshot of your Logic Model. You can also directly access the Project Logic page (2) and the Indicators page (3) by clicking on the blue arrows!
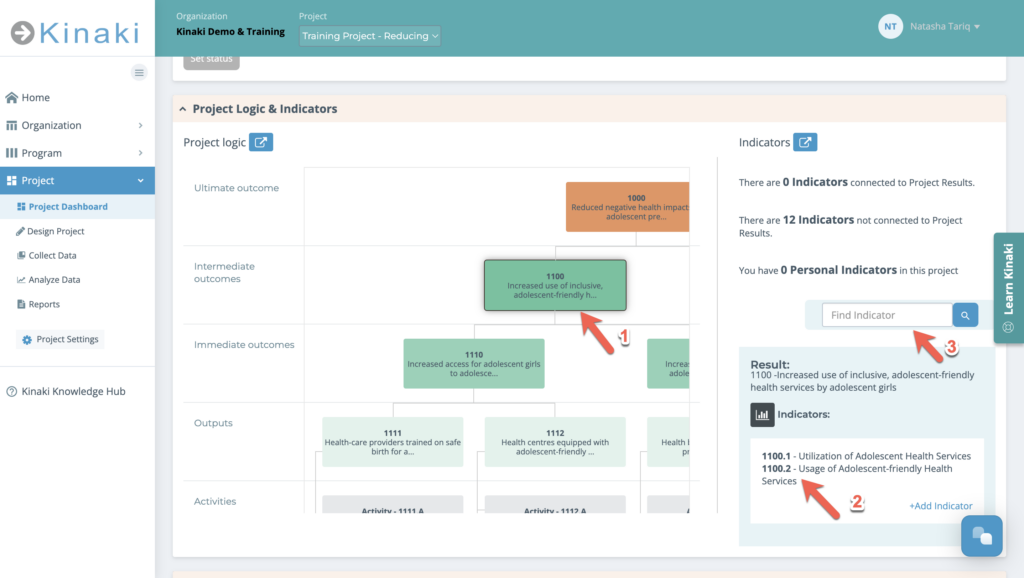
By clicking on any of the results (1), the associated Indicators will be displayed on the right (2), giving you quick and easy access to information! Another helpful feature is the Indicator search function (3), which allows you to directly search for and access the indicators you are looking for. You can also add an indicator directly from this pop-up window by clicking on “+ Add Indicator“.
Data Collection Tools
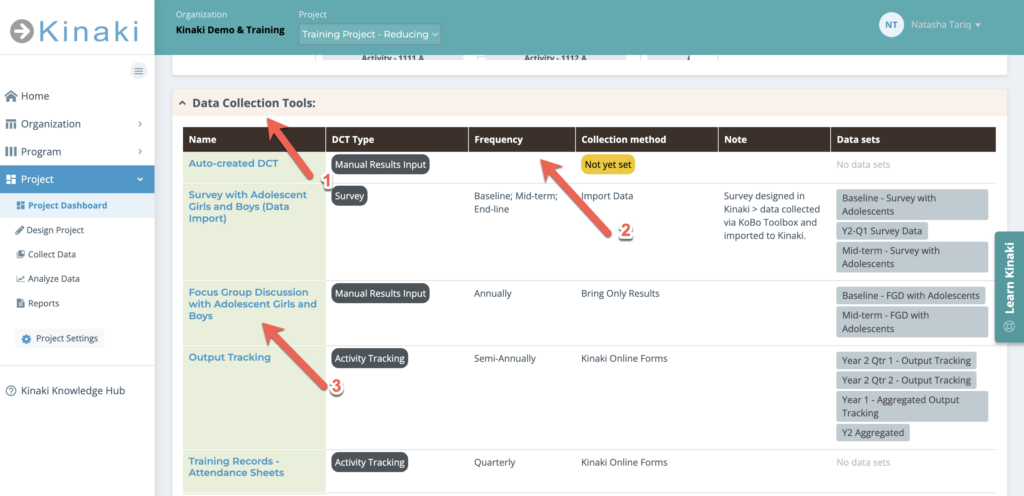
The Project Dashboard also has a Data Collection Tools (DCTs) tab (1), giving easy access to important details associated with DCTs in your project (2), like the frequency, collection method, and the names of data sets. By clicking on any DCT name (3), you will be taken directly to the ‘Collect Data’ page for in-depth details.
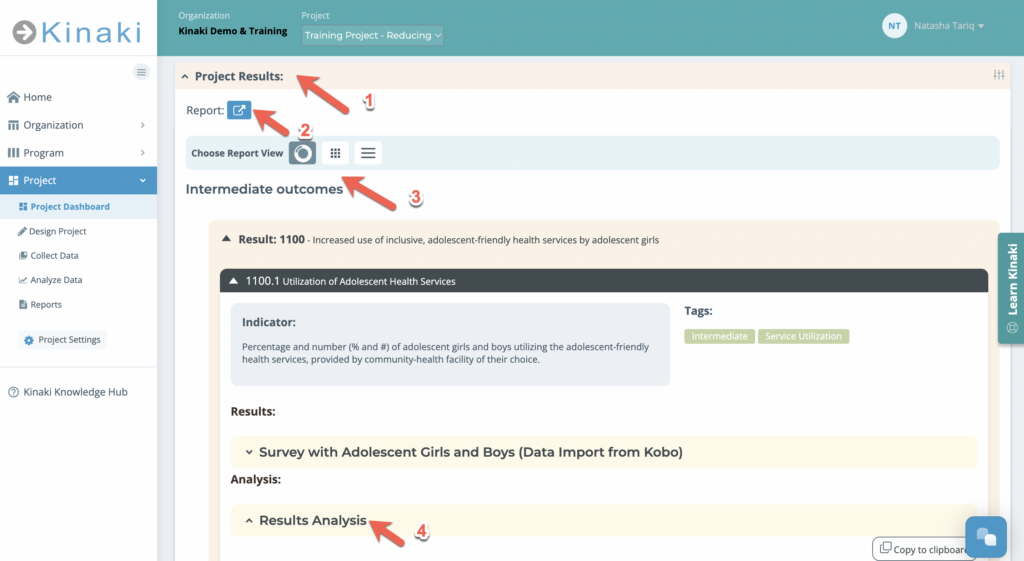
Project Results
You can also access Project Results (1) directly from the Dashboard! You can go to the Report page from here (2) and also choose from one of three options for how you want to view the report (3) in the Dashboard. As you scroll down you can read details for each Result, including, Results Analysis (4).
Project Documents and Recent Updates
You can upload project documents on the Dashboard as well! Your Project Manager may instruct you to find key project documents here.
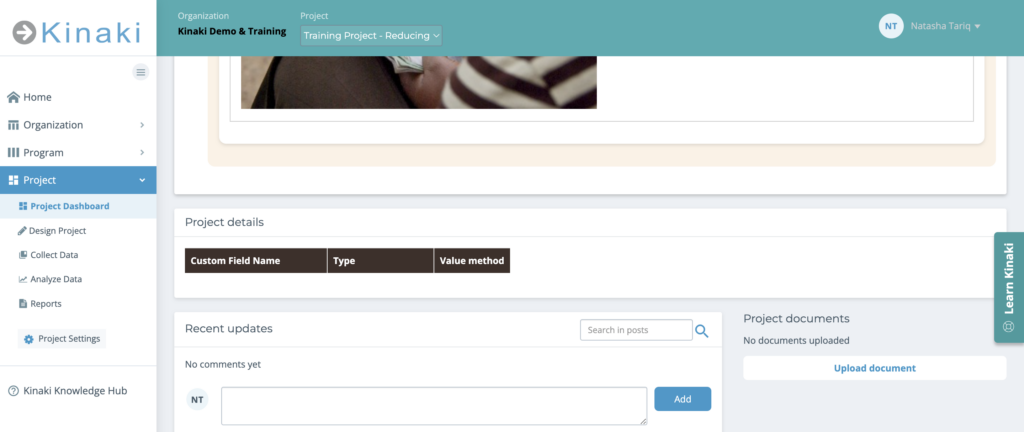
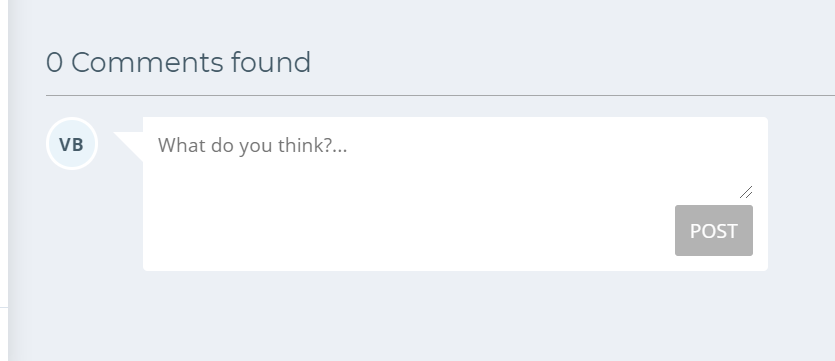
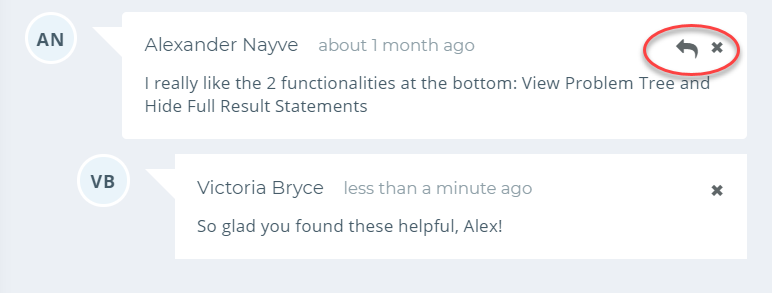
The comments function in Kinaki allows you to communicate information regarding the specific components of your project with other members of your team. To add a comment, type your message in the comment box and press “post“. To reply to a comment, use the “reply to” icon in the top right of the comment box.To delete a comment, click the “x” that is next to the reply icon.
You’ll see all the comments from the different pages on your Project Dashboard. Select the “View page” button to view the specific comment within the page where it was added.