Reporting on your Output Indicators is easy!
If you want a separate report for them, or a combined report, Kinaki had accommodate and assist your needs.
Start by creating your new report under the Reports page.
Next, go to Analyze Data to add each indicator one at a time to your new report by following the steps outlined in more detail in the Reports articles.
Choose your Data Collection Tool; Choose the Output Indicator; Set the calculation (and your filters or disaggregations); and Save the results!
After this, you can add to Report and select which Reports to add it to from the pop-out box.
The other way you can do this is to add all your Output Indicators at once!
If you have already set the calculations on the Analyze Data page, this can make your process really quick.
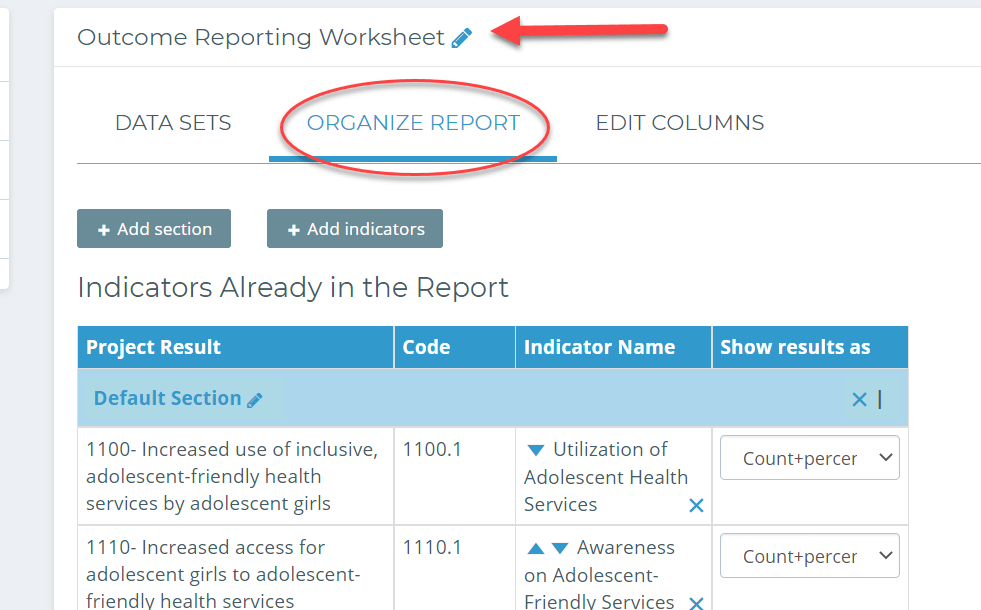
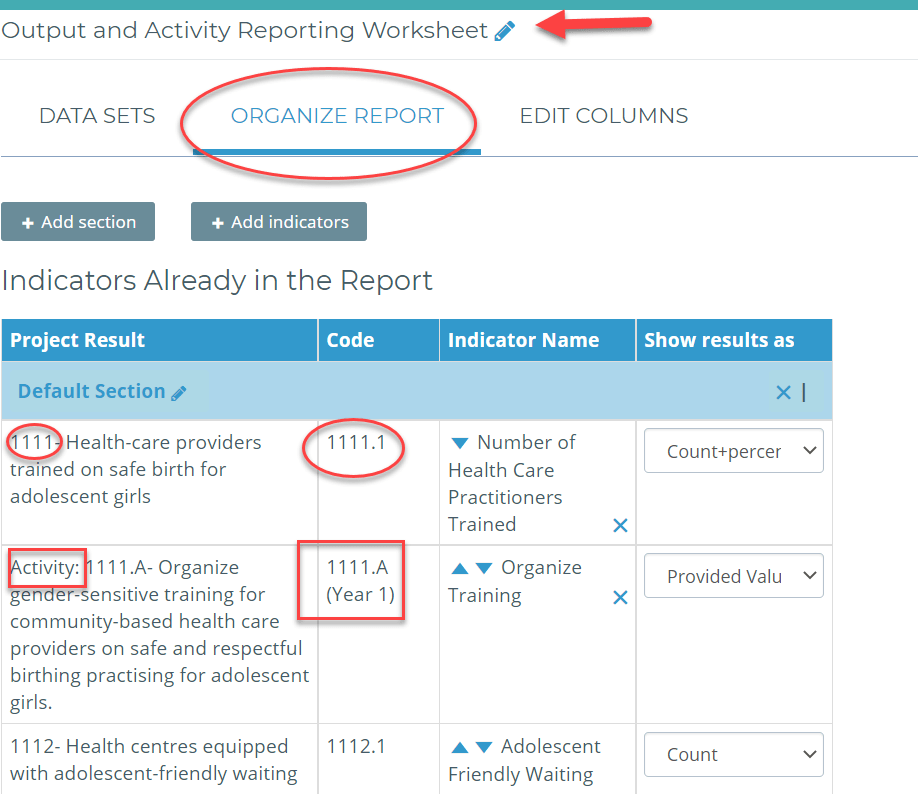
On the Reports page, go to Report Settings under the specific report you want and add all indicators at once from the Organize Report tab.

If you made an Output and Activity Report, you can add both your “Activity Indicators” AND your “Output Indicators” directly to it – and you’ll see them all clearly laid out for you to organize and adjust as needed.
Make sure you read through the rest of the articles in this series, to get a deeper understanding of the whole process.

Check out this video to learn more about designing Outputs!


