Highlights: New Features and Updates (December 2024)
We’re thrilled to introduce several exciting updates to Kinaki, designed to enhance your experience and streamline project management:
- Improved Project Dashboard: Access your Project Logic and key reports directly on the dashboard for quick insights and efficient navigation.
- Enhanced Analyze Data Page: Easily find indicators using new search options and view a detailed Results Overview, customizable to your needs.
- New Visual Reports: Share project results visually, with flexible options for charts, tables, and analysis, tailored for internal or external audiences.
- ‘Copy Project’ and Data Collection Tool Features: Save time by duplicating project templates and data collection tools for consistent and efficient setups across multiple projects.
Improved Project Dashboard:
We’ve made the Project Dashboard a one-stop destination for all of your projects’ information. You can now preview the Project Logic, Indicators and Reports directly on the dashboard. You can also open a Results Overview to see all the data sets and analysis that has been captured for a specific indicator.
Check out the video overview below and learn more on the Knowledge Hub:
Enhanced Analyze Data Page and Visual Reports:
Find indicators quickly with the new search function, find indicators by key word or code.
Set up the Results Overview directly from the Analyze Data page. The view you save will be visible in the new report type, which gives viewers a more visual overview of indicator results.
Watch the video below and learn more on the knowledge hub!
Copy Project and Data Collection Tool Features:
You can now copy projects and data collection tools to help with a more efficient set up in Kinaki.
Why copy a project?
For projects with similar logic models and indicators, it can be helpful to set up a template project which you then copy. This saves time in setting up each individual project and you can make edits and adjustments in each of the projects once they are copied from the template.
Why copy a Data Collection Tool?
The Copy Data Collection Tool function (Copy DCT) allows you to copy a DCT from any Project you are a part of to another, it also allows you to copy a DCT within the same Project. (Note: Currently you cannot copy Manual Results Input (MRI) data collection tools)
In what use cases is this feature commonly used?
If you have multiple Projects that are all collecting similar data (e.g. filling out the same indicator tracking sheets, conducting very similar surveys with only slight differences in wording) you can create the DCT in one Project and copy it over to another Project and make any modifications needed.
Within the same project it can be helpful if you use different forms (DCTs) that ask similar questions or have a similar structure but ask different questions – you can copy the DCT within the project and then edit the questions/delete/add as needed.
Learn how to copy a Data Collection Tool.
Highlights: New Feature (June 2024)
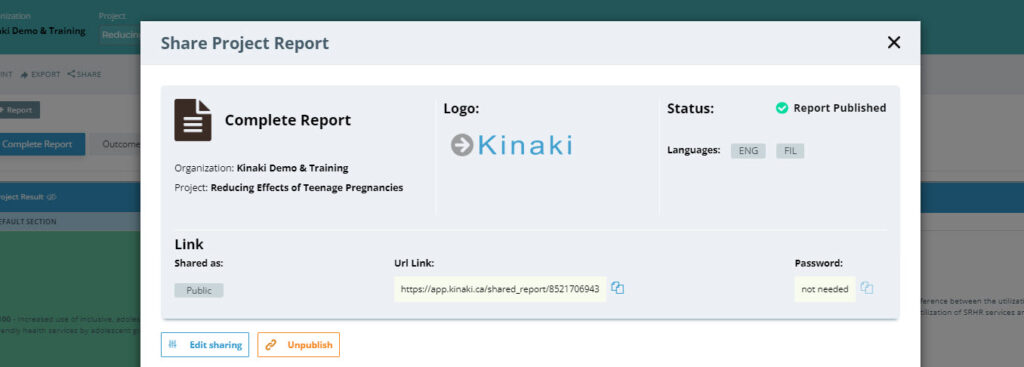
Thanks to the great feedback on the beta version of the sharable reports feature, we’ve updated the feature to make it even more user-friendly.
After working hard on collecting and analyzing your project data, we wanted to make it easier for you to share your project reports. With this new feature, you can:
Create a public or password protected link through which you can share your reports and make them available to a wider audience.
Copy the link to send yourself or email it directly from Kinaki.
Customize the report with your organization’s logo.
Check out the 2-minute video in our Knowledge Hub to learn how to use this feature.
Highlights: Latest Improvements and Fixes (July – September 2023)
We are excited to announce that we have added some new features that will take your analysis and reports to the next level!
You’ll now find a rich text editor on the Analyze Data page. This tool allows you to enrich the analysis of your indicators, adding rich text, pictures, videos, and external links that can also be added to your Reports. You can easily copy and paste formatted text to and from Word.
For example, Valeria Pesce, Digital Innovation and Partnership Facilitator, from the Global Forum on Agricultural Research and Innovation (GFAR), used the rich text editor to provide context and depth to her indicator analysis by including a chart from the calculation of another indicator that is not in her project’s official logframe.
We know that providing context is crucial in monitoring and evaluation, and this new tool makes it easier than ever to communicate your findings with clarity and precision. See the example screenshot of this feature below, where the “Results Analysis” field on the “Analyze Data” page has been populated with additional explanation and images related to the indicator:
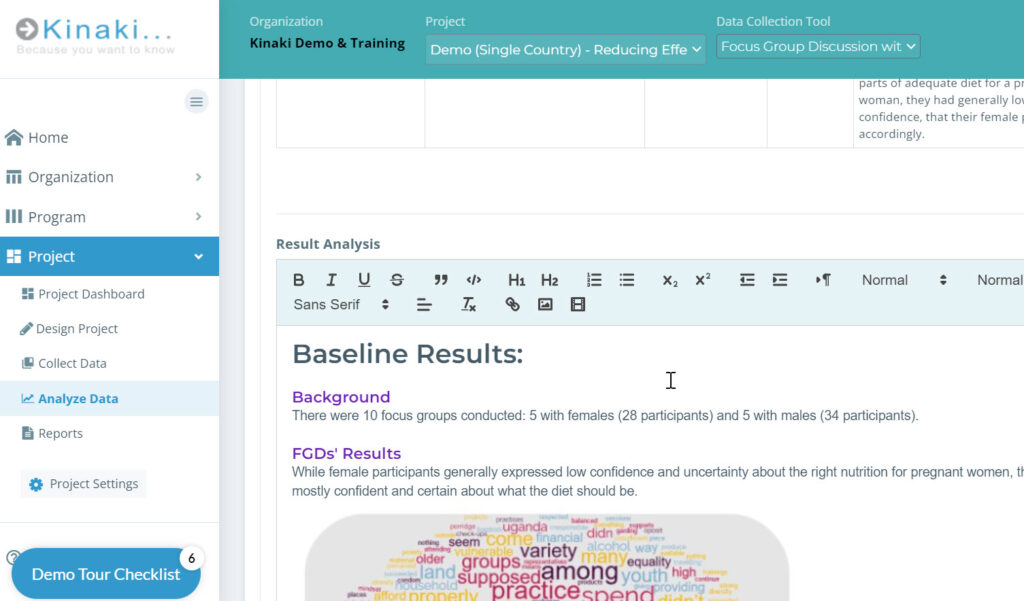
The “Result Analysis” field in the Project Report now has a quick preview and can be displayed in an overlay window in its full-length. Users can easily copy + paste formatted text to and from Word.
On the Data Collection / Data Management Pages we’ve made the following fixes:
We’ve resolved a bug where the “Records Removed” counter wasn’t showing the correct number of removed records from the active dataset on the Data Management page. Now the counter shows the correct number of records removed.
On the Program Reports page the following improvements and fixes were made:
A new button was created that allows users to easily see/hide individual Project results within the Program Report. Improvements in the readability of Program reports were made (making it easier to see the disaggregations, indicator types etc.).
Program Reports can now be deleted by Program Admins (following accepting the deletion in a confirmation modal).
A bug was fixed that caused previous Program Reports to be affected by the creation of a new Program Report.
Another issue was resolved that affected the selection of Projects included in the Program Report. Projects included in the Program Report remain selected even when the user makes changes in the Projects.
Highlights: Latest Improvements and Fixes (April – June 2023)
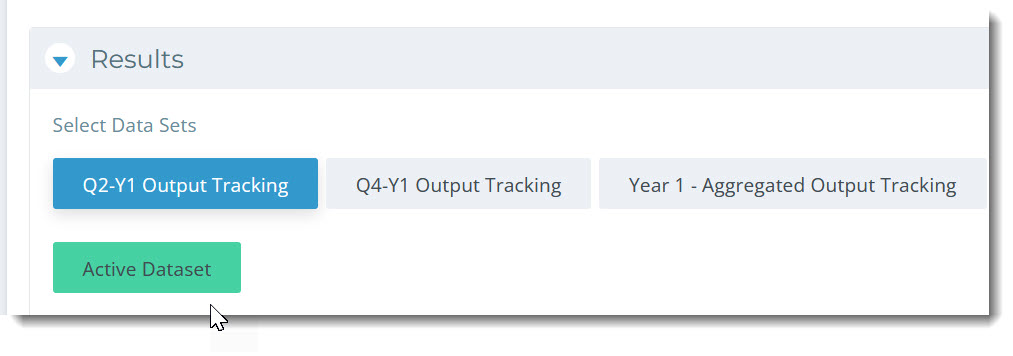
A frequent request from Kinaki users was to be able to view their ‘active datasets’ (i.e. data for which data collection is ongoing through Kinaki Online Forms or data import) to identify early results or spot potential errors early on in data collection. We’re happy to report that you can now see your active datasets on the Analyze Data page.
This update allows you to see the results of data as it’s being collected. Previously you would have to select ‘submit for analysis’ on the data management page and name the dataset, in order to analyze the data.
On the Analyze Data page – if you have a data set active for the relevant data collection tool – you’ll see the green “Active Dataset” button under the Data Sets available to select, when you click the button the dataset will appear in your results table.
Some other updates on the Analyze Data page include:
We’ve made adjustments in the default setting of handling of missing values across the Explore Data page. In the past, the Explore Data page had a default setting “All questions must be answered,” differing from the Calculate Indicator page, which had the setting “At least one question must be answered.” This variance caused some confusion. In response, we’ve standardized the default setting across both pages to be “At least one question must be answered” to provide a consistent approach to handling missing values.
A bug affecting calculations using the Text question, which included capital letters, has been fixed. Results from such calculations will now display correctly.
We’ve addressed a bug where brackets nested within other brackets could not be removed.
On the Reports page we’ve made the following updates:
We’ve resolved a bug that was interfering with report deletion. To delete a report, navigate to the “Edit Report” section and click the “Delete Report” button located at the top-right of the page.
Updates have been made so that indicators will be refreshed in a project report if you modify or remove the Data Collection tool that’s used to obtain the results for these indicators.
On the Indicators page under Design Project:
We’ve resolved a bug that was restricting Project Administrators from converting personal indicators into project indicators. You can once again employ personal indicators for preliminary analysis before making them accessible to your team.
On the Questions page under Collect Data:
We’ve rectified an issue where the Answer ID was not properly duplicated when copying a question. Now, the Answer IDs for the copied questions will precisely match those of the original.
On the Data Collection page under Collect Data:
A bug that hindered data saving for the Manual Results Input form – when an indicator lacked a selected input field type – was fixed. You can now select data for such forms. However, note that without selecting an input field type for an indicator, you won’t be able to input data for it.
On the Data Management page under Collect Data:
We’ve refined the viewing experience for images and PDF files uploaded to the Kinaki Online Form Picture question on the Data Management page.
A bug causing improper restoration of previously deleted data on the Data Management page has been addressed. You can now accurately restore all deleted data.
An issue was fixed where values for the Multiple Choice input field for the Manual Results Form were not displayed on the Data Management page. This issue did not affect the Analyze Data function where these values remained visible.
Highlights: Latest Improvements and Fixes (January – March 2023)
We have made a number of fixes and improvements over the first quarter of 2023.
Two updates we’re really excited about:
1. Uploading multiple pictures to an Online Form – this is particularly useful if you are are tracking training participants and taking pictures of any data you’re collecting on paper (which is often multi-page documents), now you can take pictures of each page and include them in your submission of an Online Form.
2. We’ve been working hard to improve the data import process. It’s a complicated feature in Kinaki since there are so many variables in importing data (i.e where did you get the data from, have you added new questions, renamed questions, added new answers etc.). Also some of the software our partners use for offline data collection were going through some updates and experiencing some bugs which made the data they exported harder for Kinaki to read. We’ve made a number of updates in the data import that will make is easier to import data from these other data collection tools. This is a feature that needs to be adaptable and our users reporting their experience has really helped to improve it.
Below is the full summary of fixes and improvements:
Data Import
We’ve made several improvements and fixes to the data import process. Here are some of the highlights:
Namely, improved switch between single choice and multiple choice.
Importing new answers no longer requires restarting the import process.
During import you can no longer skip importing new answers. Previously, you could skip the step of importing new answers/values if you had new values in your single or multiple-choice questions (and just import the answers you had previously) but this led to inconsistencies between your data file and the data imported to Kinaki. Now, you can only import all data or no data for the question with new answers.
Previously, Kinaki was only matching the columns in your data to the questions in Kinaki using the
Unique Question ID field. Now, if Kinaki cannot match the question based on the Unique Question ID it will try to match the column to the question text. This means that you can now use the full question statement as the heading in the file you are importing. (This only applies to the “Common Data Format” i.e. that from Kobo. This does not apply to files in the “Kinaki Data Format). For answers, Kinaki is already matching via the answer ID or the full answer text.
Analyze Data
On Analyze Data if you use numerical calculations in the value mode “Sum” is now the default result type and “+” is now the default operator for VALUE operations. This will save time and reduce errors since these are the most commonly used result type and operator.
We’ve fixed several bugs where a page refresh was required to see the changes made in Kinaki. There are still areas where a page refresh may be required but we are working on fixing these.
Collect Data – Questions Page
A bug when creating Drop Down questions – where answers were being duplicated when the question was being created – has been fixed.
Previously, indicators not connected to a specific result could not be included in a Manual Results Input table. Now you can include these indicators.
Collect Data – Online Form
For the Picture Question Type you can now upload multiple pictures or pdf files and how you can view them on Data Management has improved (next we’ll be working on how you can update them on the Data Management page).
The Text Question Type now includes the input of up to 5000 characters (compared to 200 previously) and the interface for editing the text question on Data Management has also improved.
A bug where the link did not show up right away after publishing an online form, has been fixed.
Collect Data – Data Management
Drop down questions can now be edited on the Data Management page.
Collect Data – Set Logical Flow
We have added buttons to navigate around the logical flow and a “Refresh View” button which takes you back to the beginning of the flow and zooms out.
Design Project – Indicators
For Indicators export – previously all personal indicators were included in the export, now the personal indicators are only included for those that created them.
Reports
Indicators using VALUE in the disaggregation calculation showed the incorrect type of results. This has now been fixed. If these indicators have been included in your report, you may need to delete and recalculate the indicator before adding it back into your report.
We fixed a bug where the order of indicators in a report were incorrect. If you still experience this bug, please reach out to us on the live chat or helpdesk@kinaki.ca so we can follow-up further.
Several other small bugs were fixed to improve the Kinaki experience.
Highlights: Latest Improvements and Fixes (December 2022)
Importing questions and data
Ever wonder what the original file you uploaded looked like? Now when you import data and questions to Kinaki, it saves the original file uploaded to Kinaki. This helps in case you want to return to the original file later to see the state of data and questions at the time of import.
Also, each time you click “Submit Data for Analysis”, Kinaki archives the questions as an Excel file so you can see the questions at that point in time.
You’ll see the archives on the Data Management page under Manage Datasets > Submitted Data Sets.
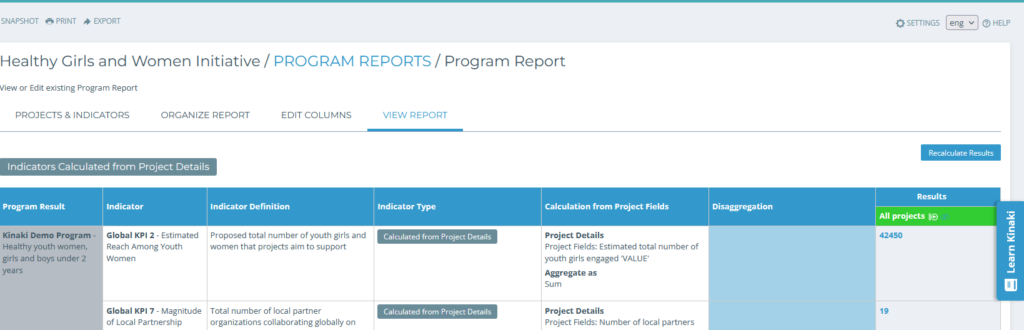
Program Reports
If you’ve found yourself wondering how to update results in a Program Report there is a new “Recalculate results” button to make this more intuitive. (Remember: to update calculation in Project Reports, click on “Save Indicator” on the Analyze Data page.)
Kinaki Online Forms
More file type options for the “Picture” question type: You can now upload a PDF file, in addition to image files, when you have a “Picture” question in an Online Form.
Analyze Data
You’ll now get a warning to change your calculation if you use a numeric calculation when you shouldn’t.
Question Type
To prevent confusion during data analysis, you can no longer change the Question Type for questions with data already collected (this way a question will not be accidentally assigned an incorrect question type). If you find you do need to change a Question Type for a question with data already collected, rename the original question and create a new question with the original name.
If you are using Kinaki Online Forms for collecting data, remember to include the new question in the form as well. Also, if that question is being used for the calculation of an indicator, remember to update the calculation on the Analyze Data page.
Other Updates and Fixes
To increase security, resetting your password and changing your email now requires confirmation using an email code instead of using security questions.
We’ve improved the complexity of calculations on the Analyze Data page. A higher number of questions in brackets can now be created to calculate those really complex indicators!
Various improvements have been made to the data import process.
We’ve introduced Answer IDs which are used for matching data during data import (similar to the unique Question ID for matching questions).
Data Collection Tool Updates (August 2022)
We’ve been making some changes!
If you haven’t seen it yet, you’ll notice some improvements the next time you go to create a new Data Collection Tool.
Under the ‘Collect Data‘ tab, you will be asked to select the data collection type:
(Don’t worry about the selection too much, it can always be changed later!)
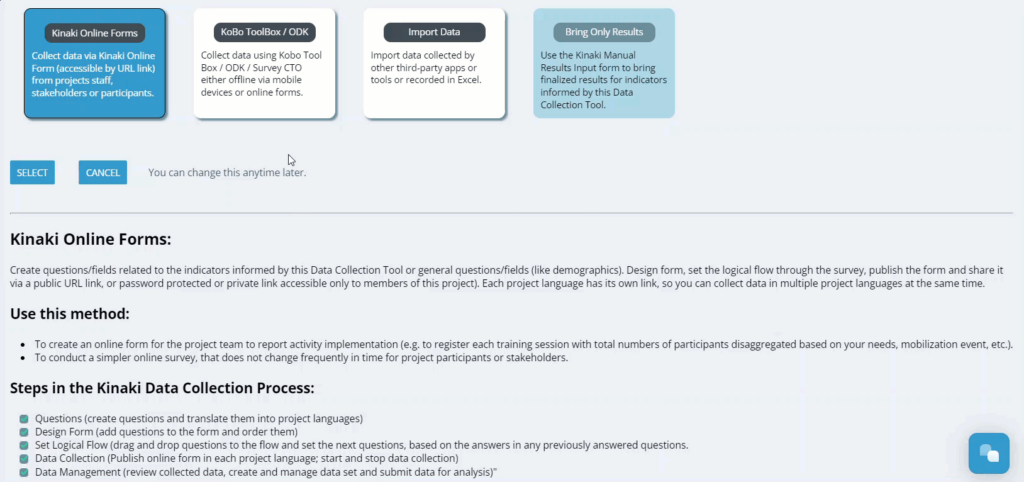
When you make your selection, you’ll be guided through specific steps to set up your Data Collection Tool or get your data into Kinaki.
In addition, this selector will appear for all existing Data Collection Tools for which the method was not selected yet.
These changes are aimed to make Data Collection Tool design more streamlined and specific for the different ways to collect data.
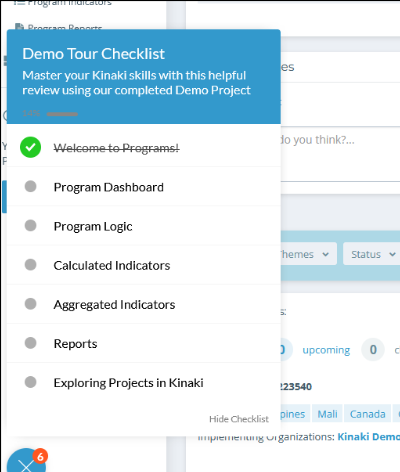
Program Features (June 2022)
Did you know you can use Kinaki to aggregate data across multiple projects and track results across your organization?
With the Program features you can set up dashboards to aggregate results across multiple projects, create reports for all projects supported by one donor, track global performance indicators and much more. Learn how to use the Program features by taking the Program Demo Tour.
Make sure you’re getting the most out of the Program features by checking out our latest learning tools:
1.Take the interactive and self-paced Program Demo Tour.
2. Go through the learning journey step-by-step in the Knowledge Hub.
3. Watch the latest video tutorial on setting up Program Indicators.
Why use the Program Features?
a. Organize your portfolio of projects, for example by donor, theme or country.
b. Measure standard or global indicators across your projects.
c. Make reporting on multi-country and multi-partner projects easier by creating a Program to aggregate data across all the projects.
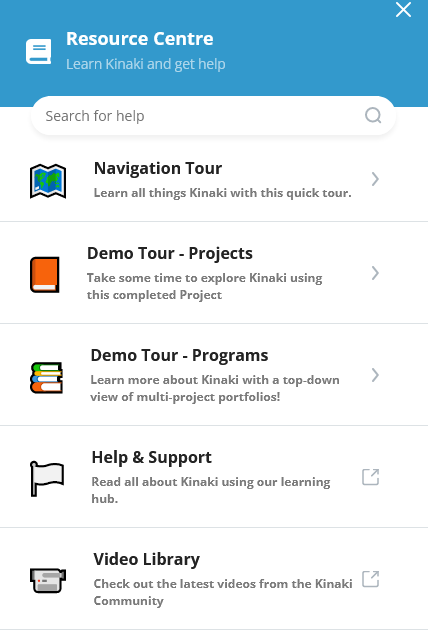
Resource Centre (May 2022)
Did you know we update the Resource Centre regularly with new content?
In the ‘Help & Support’ section you might be interested in some of the latest articles like how to use Kinaki with external apps, such as Google Translate and KoBoToolbox.
Log-in and click on “Learn Kinaki” on the right hand side of the page to open the Resource Centre. There you’ll find a Navigation tour, all the Help & Support articles, and Video Library.