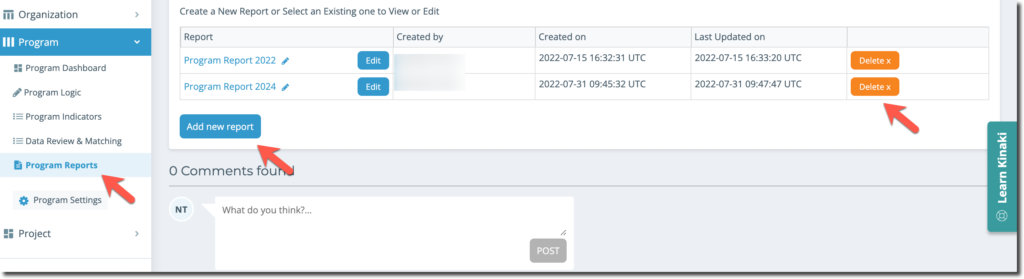
Start by selecting Program Reports in the side-bar menu under Programs.
On this page, you can edit an existing report, or add a new report using the “Add new report” button.
Once you select to add a new report, you need to title and ‘Save’ your report.
Next you will be taken through a series of steps to finalize the creation of your Report:
1) Selecting the Projects and Indicators that will be a part of the Report
2) Organizing the Report, where you can decide how you want the data displayed and in which order you want the indicators to appear
3) Editing Columns (an optional step if you want to add or hide columns in your Report)
4) Viewing the final Report.
Let’s review each of these steps:
1) On the “Projects & Indicators” page:
First, select the Projects you’d like the results to come from, and scroll down the page to select the specific indicators you’d like to see in your Program Report. Check the box to the right of each Project and Indicator you want to include.
Be sure to save your work at the bottom of the page using the “Save” or “Save and Next” button.
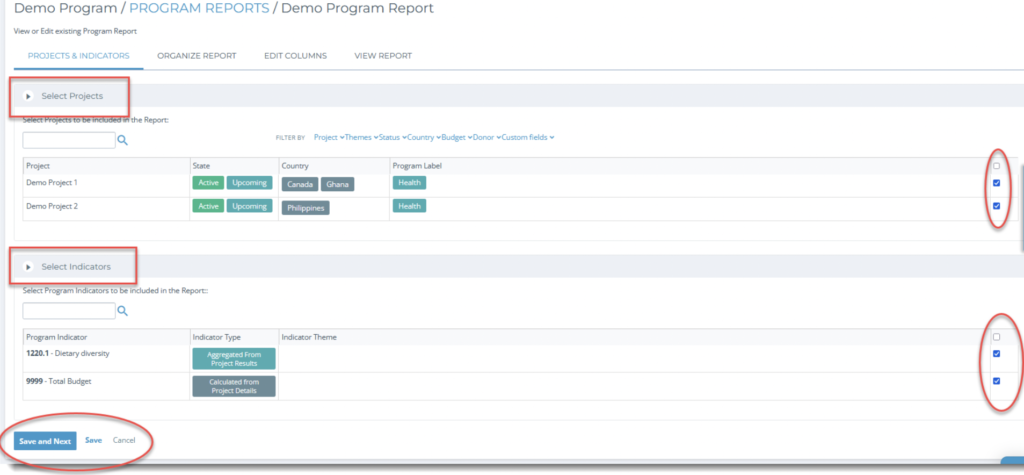
When you select “Save and Next” you’ll be taken to the “Organize Report” tab.
2) On the “Organize Report” page:
You can create the design of your Report. You can move the order of Indicators within their categores (those calculated from Project Details, as well as those aggregated from Project Results). And select how you want the result displayed by selecting an option from the “Aggregate as” drop-down menu. When you are ready, select “Save and Next”.
[Note: you will not see “Program Data Sets” until you do the “Data Review and Matching” step, which we cover in another article in this series.]
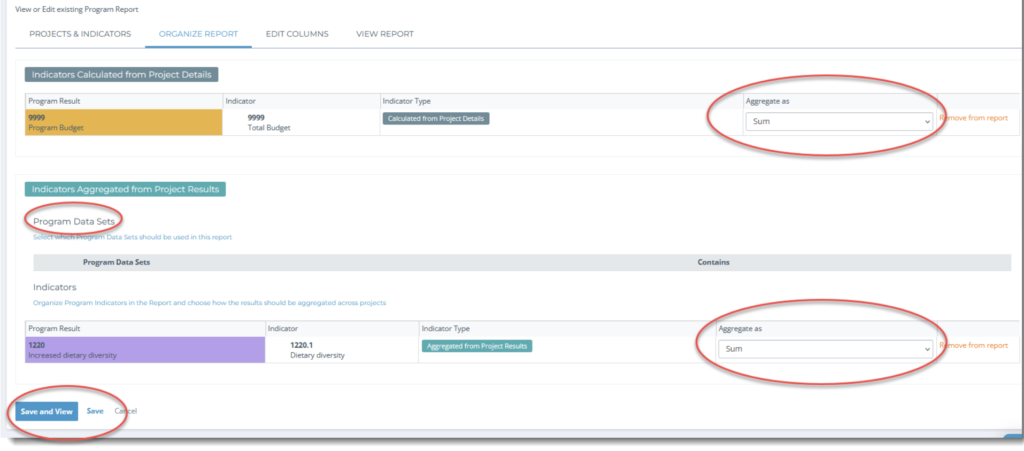
This will take you right to the “View Report” tab where you can see your completed Report.
3) On the “View Report” page:
You will see in the Report the results for “Indicators Calculated from Project Details” and the “Indicators Aggregated from Project Results”. (In this example you do not see the results for the Aggregated indicators yet, we’ll review how to add these results on the “Data Review & Matching” article.) If you click on the small icon next to “All Projects” you will be able to see the individual data for each of the Projects belonging to the Program. You can choose between ‘Show Projects’ and ‘Hide Projects’ to suit your needs.
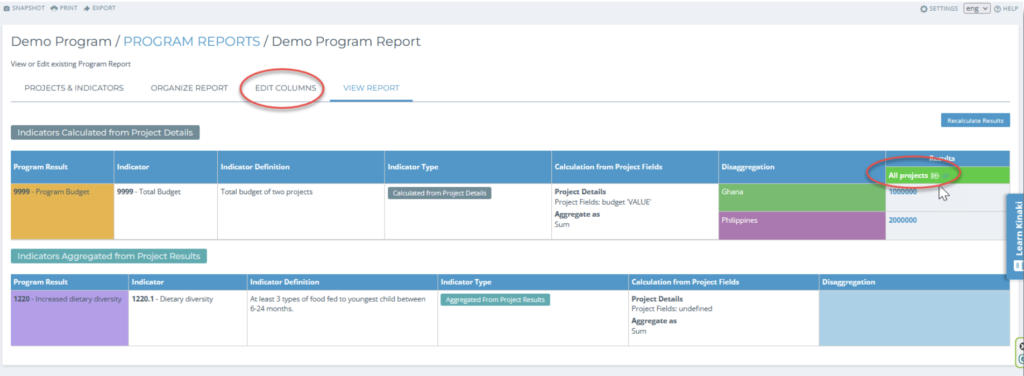
From the View Report page, you can also navigate back to the “Edit Columns” page if you’d like to re-arrange your columns, hide them, or add custom column.
Let’s look at how to Edit Columns in the next article.