In this section, we’ll show you how you can use your datasets to measure progress towards your indicators that you created earlier.
We’ll walk through how to select an indicator to analyze, calculate the results of that indicator, and disaggregate results so you can see them in the way you need to. You can add your results directly into a report from here! Just make sure you create a report first so you have something to add to.
Note:
If you are a Project Admin you will be able to analyze data for the indicators in your Project.
If you are a Project Member you will be able to create personal indicators that are only visible to you. Contact your Project Admin if you need your user type changed.
Getting Started: Submitting Data Sets
On the ‘Data Management’ page, you will see the ‘Active Data Set’ tab and the ‘Manage Data Sets’ tab. The image below shows an active data set.
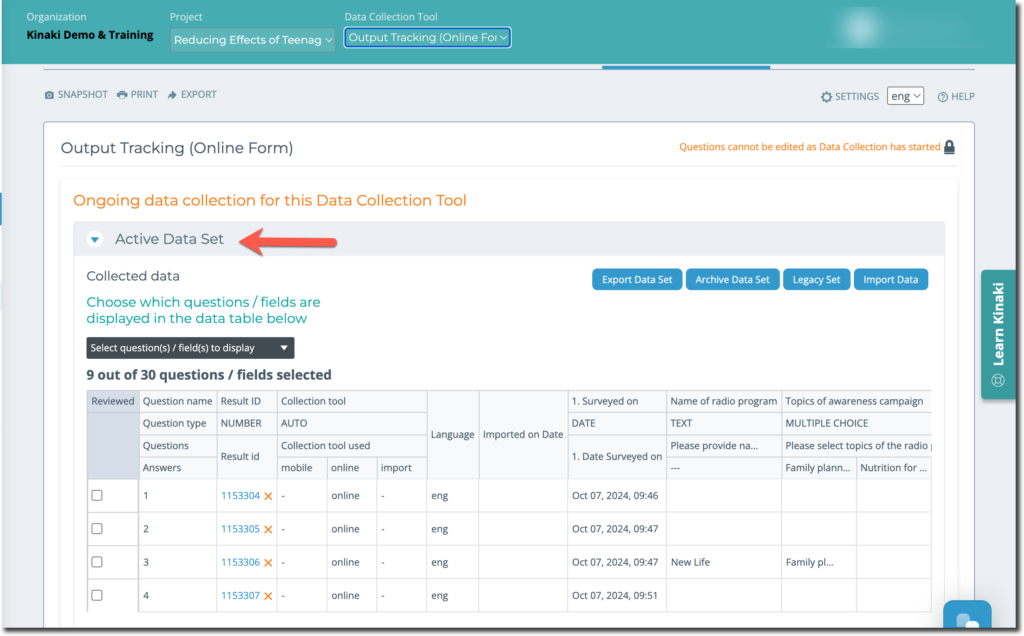
If your data is in the “Active Data Set” section, you’ll see it appear as the “Active Data Set” on the Analyze Data page. If you have completed collecting data and you are ready to give the data set a name, you can select the “Submit Data Set” button below the active data set and give the data set a name (e.g. Baseline, Yr2 Q2 Output data, etc). Then it will appear on the Analyze Data page with that name. For more information on submitting data sets, on the “Data Management” page under the “Collect Data” section.
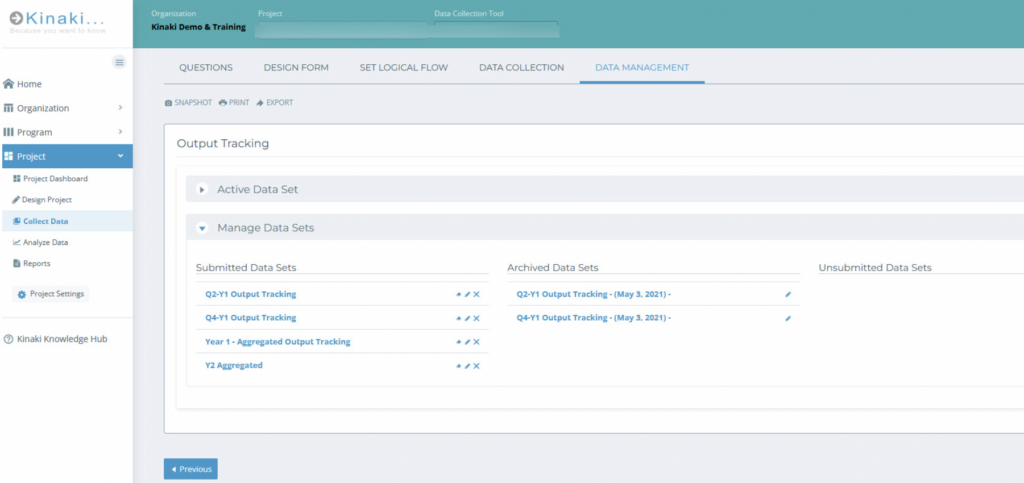
You can see the data sets that have already been submitted, under the ‘Manage Data Sets’ tab.
In the next article, let’s learn how to select an indicator to analyze!