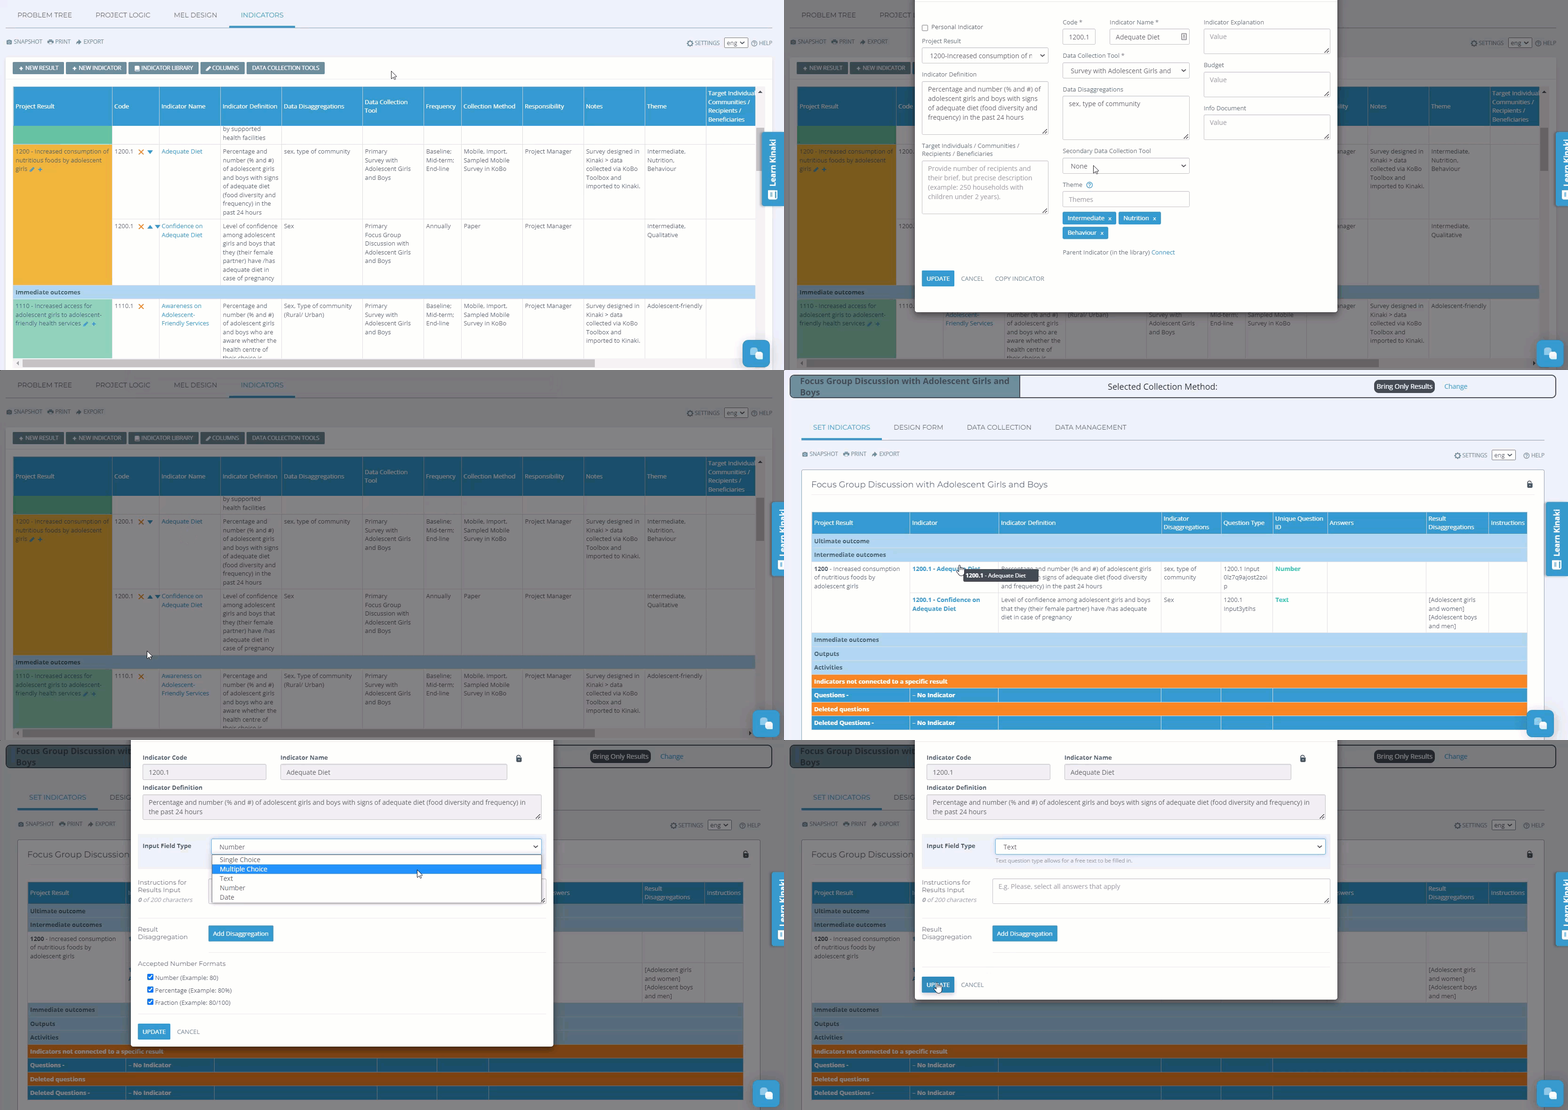
As Manual Results Input forms focus only on results, there are no traditional questions in a Manual Results Input form. To create entries of the Questions page, you must attach the DCT to a series of Indicators:
1. Visit the Indicators page under Design Project.
2. Edit the details of your Indicators by selecting the title.
3. In the pop-up window, add your MRI Form as a data collection tool.
4. This may be best suited as a secondary DCT, so you can still measure future values with another tool.
5. Return to Collect Data. On the Set Indicators tab, you will now see any indicators that are attached to this DCT from the previous page.
As a first step, review all of the indicators listed on this tab. Should all of these indicators be measured with data gathered from this Data Collection Tool? Are there any indicators missing? If so, go back to the “Indicators” page under “Design Project” and assign this Data Collection Tool to the appropriate indicators. If all of the indicators are correct, you can begin adding Questions/Data Entry.

To begin, select an indicator. A pop-up window will appear where you can select the Input Field Type (i.e. the type of data you want entered for this indicator). You can select from the following:
| Question Types in Kinaki | Description |
| Single Choice | The respondent can select one response from a list of possible answers. |
| Multiple Choice | The respondent can select any number of responses from a list of possible answers. |
| Text | Text can be inputted as answer. Minimum and maximum number of characters required can be adjusted. |
| Number | A number can be inputted as an answer. The type of number can be specified (e.g. Percentage or Fraction) Note: if you collect results directly entered as percentages only, these results cannot be aggregated at the program level. |
| Date | A date can be inputted as an answer. |
Additionally, you can add:
- Instructions for the person entering the data: This ensures they enter the right kind of data and understand the information you need entered.
- Results disaggregations: Select “Add Disaggregation” to add a new field and label it with the information that should be entered. Each Disaggregation you add will appear as a new field to be entered in your form.

Once you have added input fields and instructions for each of your indicators, you are ready to go to “Design Form”.
Adding, Editing or Modifying Disaggregations
Before you start collecting data, you can add or delete disaggregations or makes any changes to disaggregations when you create your indicators, without any problem.
Note: Once you have started data collection, adding, deleting or making changes to a disaggregation will lead to loss of data. Kinaki will warn you if you try to make these changes, to guard against any potential loss of data.
For example, you have already started collecting data, and you realize that you need to add a disaggregation for an indicator that did not have any. You stop data collection and go back to ‘Set Indicators’ page and click on the indicator and select ‘Add Disaggregation’. You will get a message warning you about ‘Potential Data Loss’. You will also be advised to instead ‘Add a copy of the indicator with the desired disaggregation’ as a potential solution. If you add a copy of an indicator or create a new indicator and add it to this Data Collection Tool, you can add your desired disaggregation instead of making changes to the indicator that already has some data and avoid data loss. When you add this new indicator, you will still get a notification about potential data loss, but since you don’t have any data in this new indicator yet, you can proceed without any issue and create your desired disaggregation. This workaround allows you to preserve the values in the original indicator, and the new values and disaggregation in the datasets submitted in the newly created indicator.
Similarly, if you have started data collection, and you realize that you need to delete a disaggregation for an Indicator, you will also be warned about loss of data. If you go to the ‘Set Indicators’ page and try to delete a disaggregation for the indicator, you will get a message that ‘The Indicator contains data’. You will be notified that deleting the disaggregation will permanently delete all associated data and the action cannot be undone.
